66-14
User Guide for Cisco Security Manager 4.4
OL-28826-01
Chapter 66 Viewing Events
Overview of Event Viewer
• View Settings pane (2)—Use the View Settings pane to define the column filters and color rules to
use in a view. You can open and close the pane by clicking anywhere in the heading or by toggling
the View > Show View Settings command.
The View Settings pane contains two tabs: Filter and Color Rules. These tabs are shown along the
bottom of the pane. On each tab, the body of the tab shows the current filter or rules; to change a
rule, you select it and click the Edit or Delete buttons along the top of the pane, as appropriate. To
create new rules, click the Add button.
You can also add filters using the column filtering controls in the events table, as described in
Creating Column-Based Filters, page 66-41. For more information on color rules, see Configuring
Color Rules for a View, page 66-36.
• Event Table Toolbar (3)—The toolbar above the event table includes shortcut buttons and other
controls that relate specifically to the events listed in the table. For a description of the toolbar
controls, see Event Table Toolbar, page 66-14.
• Event Table (4, 5, 8)—The event table shows the events that match your filter criteria, one event
per row. These events might be retrieved from the primary or the extended data store; you do not
have to explicitly request data from the extended data store. To see events from a device, you must
have View Device privileges to the device.
The columns that make up the event table can be hidden, resized, reordered, and sorted upon as
described in Customizing the Event Table Appearance, page 66-35. For a description of the
columns, and how to use the column selector button to choose which columns are shown, see
Columns in Event Table, page 66-16.
If a column has a filter applied to it, an icon appears in the column heading.
• Time Slider (6)—For historical views, the time slider shows the current slice of time displayed in
the table and the events per second rate as a linear graph. For more information about using the time
slider, see Time Slider, page 66-23.
• Event Details Pane (7)—The event details pane shows detailed information about the currently
selected event. You can open and close the pane by clicking anywhere in the heading or by toggling
the View > Show Event Details command. For more information, see Event Details Pane,
page 66-24.
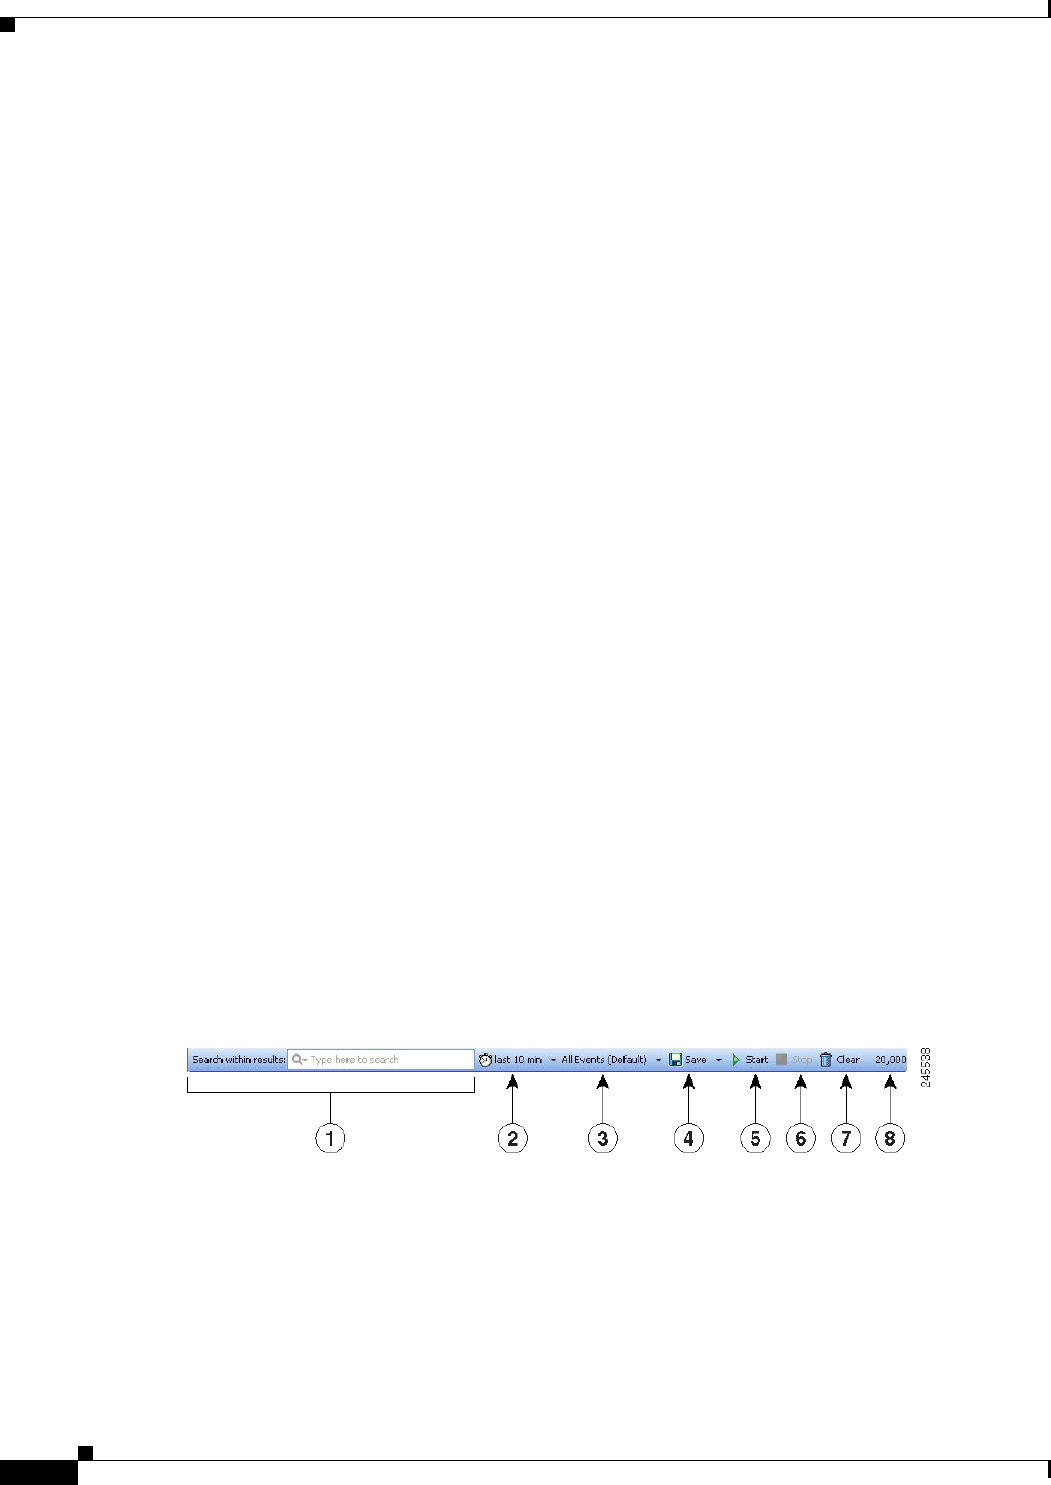
Event Table Toolbar
The following illustration and table explain the elements in the toolbar that resides immediately above
the event table in Event Viewer.