


66-29
User Guide for Cisco Security Manager 4.4
OL-28826-01
Chapter 66 Viewing Events
Managing the Event Manager Service
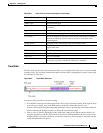
To view detailed information, click on the alert status icon. A bubble opens that shows summary statistics
for the past five minutes, including the number of events received and dropped and event server alert
messages, if any. Click the alert status icon again to close the bubble.
When the bubble is open, you can click the Details link in the bubble to view more detailed information.
Clicking the Details link opens the Event Statistics Details dialog box, which shows the following
information:
• Last 5 Minutes Statistics:
–
Events Received—The total number of syslog events Received and SDEE alerts retrieved in the
past five minutes by the service.
–
Events Dropped—The total number of events or alerts that the service had to drop due to
congestion. This number indicates drops from monitored devices only, so the number should be
zero in normal circumstances. A non-zero number indicates that the service is in throttle mode;
look for messages in the Event Server Alerts section.
–
Events from Unmonitored Devices—The number of syslog messages sent to the server that
came from devices that are not selected for monitoring (as described in Selecting Devices to
Monitor, page 66-31).
Events from unmonitored devices are always dropped, but they do place a load on the service.
The IP address of the last unmonitored device detected is shown; use the IP address to determine
the source of the messages. You can then determine if the device should be added to the
monitored devices list, or if you need to alter the device’s configuration to remove the Security
Manager server from its list of syslog servers.
If the device that is sending messages is outside of your network, adjust the firewall
configuration to prevent this syslog traffic from entering your network.
• Status Information:
–
Total Events Per Second (EPS)—The rate at which events are currently being processed. This
measure does not include dropped events.
–
Event Buffer Used—The percentage of the shared event buffer that is currently being used to
process events. The bar is color-coded to indicate the throttle level:
Green—Not in throttle mode.
Yellow—Low severity events are being dropped.
Orange—Low and medium severity events are being dropped.
Red—High severity events are being dropped.
• Event Server Alerts—These messages indicate specific status problems that you might need to
address. Table 66-8 explains the messages that you might see with possible solutions.
• Copy button—Click the Copy button to copy the information to the clipboard. The copied
information includes HTML markup. You can paste the information into an HTML file.
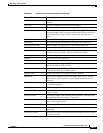
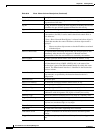
Table 66-8 Event Manager Status Messages
Alert Message Alert Level Possible Action
UDP port <514> could not be
acquired, therefore syslog events
cannot be collected.
High Some external application might already be using
the indicated port (the default syslog port is 514).
You might need to stop that external application.
You can use the netstat command to identify the
PID of the process, for example, netstat -ao |
findstr 514.