67-12
User Guide for Cisco Security Manager 4.4
OL-28826-01
Chapter 67 Managing Reports
Overview of Report Manager
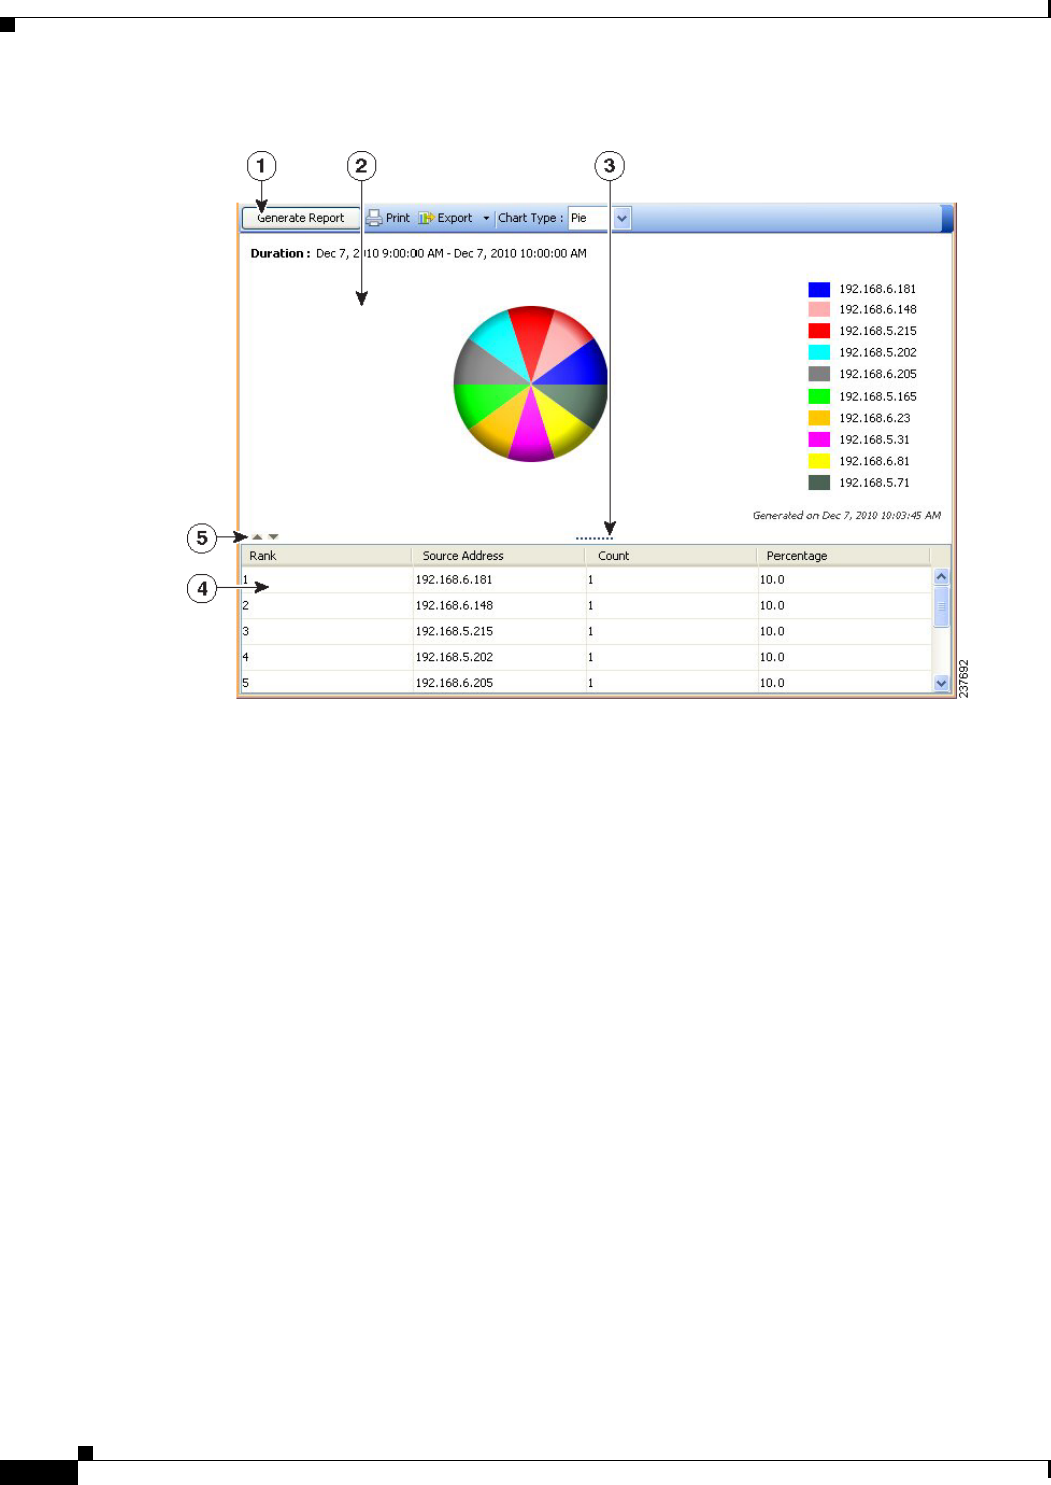
Figure 67-4 Report Manager Generated Report Pane and Toolbar
The Report List includes the following controls (illustration call-outs cited):
• Report toolbar (1)—The top of the generated report pane is a row of controls for generating and
manipulating reports. The controls have the following functions:
–
Generate Report button—Generates a report based on the criteria defined in the report settings
(in the upper pane). For more information, see Opening and Generating Reports, page 67-18.
–
Print button—Prints the generated report. For more information, see Printing Reports,
page 67-23.
–
Export button—Exports the report. Click the down arrow in the button and select the type of file
you want to create: As PDF (for Adobe Acrobat) or As CSV (for comma-separated values). For
more information, see Exporting Reports, page 67-23.
–
Chart Type—Determines the type of graphical chart displayed in the upper part of the report,
typically pie, bar, and XY (linear) graphs are available. In some cases, you do not have a choice
of chart types. For more information, see Opening and Generating Reports, page 67-18.
• Graphical view (2, 3, 5)—The top part of the generated report shows a graphical, color-coded view
of the report data, and includes a legend that explains the colors. Also included is the date and time
the report was generated.
At the bottom of the graphical view are the following controls:
–
Up and Down arrows (5)—These icon buttons, to the left of the graphic, allow you to open and
close the graphical part of the report.
