


67-19
User Guide for Cisco Security Manager 4.4
OL-28826-01
Chapter 67 Managing Reports
Working with Reports in Report Manager
Related Topics
• Overview of Report Manager, page 67-6
• Creating Custom Reports, page 67-20
• Arranging Report Windows, page 67-25
• Troubleshooting Report Manager, page 67-31
Step 1 In Report Manager, do one of the following to open a report:
• Double-click the name of the report in the report list (in the left pane).
• Select the report in the reports list and select File > Open.
• Right-click a report in the reports list and select Open Report.
The report opens with the report settings pane open and the report content area empty.
Tip You can have five reports at most open at one time. You can also collapse the report settings pane
to provide more room for viewing the generated report by clicking on any area of the settings
toolbar that is not a button that performs another function.
Step 2 (Optional) Verify that the report settings contain the desired values, for example, the desired time
window for the report. The settings for system reports are based on the system defaults (which you can
configure as described in Configuring Default Settings for Reports, page 67-24). The settings for custom
reports are those that were last saved for the report.
If you need to change the settings, click the Edit button in the settings toolbar and make your changes
in the Edit Settings dialog box. For more information, see Editing Report Settings, page 67-21.
Tip Be sure to save your changes if you want to make them permanent. If you change the settings
for a system report and you want to preserve them, you must use Save As to create a new custom
report; you cannot change the settings of a system report from the default settings.
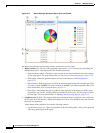
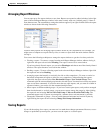
Step 3 Click the Generate Report button below the settings pane to retrieve the report data from the reporting
database and to display the resulting information. The information is displayed in two formats:
• Graphical—A graphical representation of the data is shown in the top part of the report. You can
select different types of graphics from the Chart menu above the report data: pie, XY (for linear
graphs), and bar. If there are more than 10 items in the report (for example, you configured a Top
report to show 25 values), all values after the tenth are summarized in the chart as “others.”
Some reports, such as the IPS Target Analysis report, use scatter plots. For these reports, you do not
have the option to select a different graphic type.
• Tabular—The table below the graphic lists the data used to generate the graphic. The table has
different columns based on the type of report. Following are some typical columns; for more detailed
information about the content of each report, see Understanding the Predefined System Reports in
Report Manager, page 67-13.
–
Rank—The order of the information by magnitude. For example, for a firewall top destinations
report, a rank of 1 indicates that the destination is the most used in the evaluated events.
–
(Name of reported characteristic)—There is always a column whose name is based on the
characteristic targeted by the report, for example, Source/Destination (IP addresses), Service
(protocol and port), or User (usernames).