


66-28
User Guide for Cisco Security Manager 4.4
OL-28826-01
Chapter 66 Viewing Events
Managing the Event Manager Service
Related Topics
• Monitoring Event Data Store Disk Space Usage, page 66-31
Step 1 In the main Security Manager window (not Event Viewer), select Tools > Security Manager
Administration and select Event Management from the table of contents.
Step 2 Do one of the following:
• To enable, or start, the Event Manager service, select Enable Event Management.
• To disable, or stop, the Event Manager service, deselect Enable Event Management.
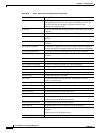
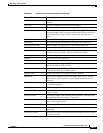
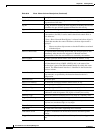
You can also change the other settings, such as the event data store location and maximum size, the
syslog port to which devices should send events, and the pagination size (which determines the
maximum number of events loaded into the event table). You can also configure an extended event
storage location to augment your primary storage location. For detailed information about these settings,
see Event Management Page, page 11-22.
Step 3 Click Save to save your changes.
If you changed the Enable Event Management option, you are prompted to confirm that you want to start
or stop the Event Manager Service. If you click Yes, the service is started or stopped immediately, and
you are shown a progress indicator and told when the change is completed. Wait until the status change
is completed before continuing.
If you change other settings, with the exception of the pagination size, the Event Manager service must
be briefly stopped and restarted. You are shown a progress indicator.
Monitoring the Event Manager Service
The Event Manager service processes incoming syslog messages and retrieves SDEE alerts from
monitored IPS devices. The amount of data processed varies depending on network activity. There can
be times when the events per second (EPS) generated in the network is higher than the service can
handle, in which case the service goes into throttle mode, selectively dropping events.
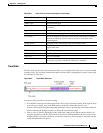
You can monitor the status of the service to identify congestion and address problems that arise. The
status of the service is shown in an icon in the lower right corner of the status bar in Event Viewer, as
shown in Overview of Event Viewer, page 66-7. The Total EPS indicates the current events per second
rate that the service is experiencing. The alert status icon color indicates the following:
• Green dot—There are no problems. All events are being processed normally.
• Yellow dot—There are some warnings, for example, low severity events are being dropped.
• Orange dot—There are more serious issues, for example, low and medium severity events are being
dropped.
• Red dot—There is a critical situation, for example, high severity events are being dropped or there
is a significant problem with the system, such as problems with the syslog port or with the event data
store location.
• Disconnected network wire—The Event Manager service is disabled, either intentionally or due to
some server problem; no events are being stored or retrieved. If this is not intentional, restart the
Event Manager service as described in Starting, Stopping, and Configuring the Event Manager
Service, page 66-27.