


68-26
User Guide for Cisco Security Manager 4.4
OL-28826-01
Chapter 68 Health and Performance Monitoring
Monitoring Devices
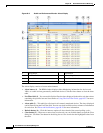
Monitoring Views: Device or VPN Details
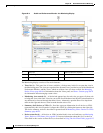
The HPM Window: Monitoring Display, page 68-23 presents views and detailed information about the
currently selected device or VPN. All device-related views and the VPN Summary view provide three
or four tabbed panels of detailed information for the individual device or VPN currently selected in the
device-status table above it. (The Remote-Access Users and Site-to-Site Tunnels views do not provide
this details panel.)
The information presented for each type of view follows.
• For the All Devices, Firewall Devices, IPS Devices, Priority Devices, and custom device-related
views, the tabbed panels are:
–
Health – A “snapshot” of device status, including graphic displays for certain metrics such as
CPU and memory usage. With firewall and IPS devices, the top section of this panel includes:
–
The Health entry indicates general overall status, and can be Normal, Warning, or Critical,
based on number and type of alerts triggered on the device. Click the i button for a pop-up view
of current device metrics.
–
The Alerts entry indicates current alert level; also can be Normal, Warning, or Critical. The
numbers of triggered Critical and Warning alerts are indicated, followed by a View hyperlink.
Click the link to switch to the Alerts display with only the alerts for this device listed.
Note For IPS devices, certain health-metric thresholds must be configured separately on the
individual devices—that is, outside of HPM. Therefore, it is possible for the health of
an IPS device to be critical, for example, without any indication in HPM. See Alerts
Configuration: IPS, page 68-32 for additional information.
–
Used Memory and Free Memory indicate respectively the amount of device RAM in use, and
the amount available; both values are megabytes.
–
Total cluster nodes is the total number of devices assigned to the selected ASA cluster, along
with the number of those nodes currently Up, Down and Undiscovered.
–
Device Information – This panel provides a read-only listing of device-specific information
such as device name, IP address, device type and model number, and so on. A read-only listing
of Failover information is also presented. If an ASA cluster is selected, the Failover listing is
replaced with a listing of cluster-related information.
–
Traffic – This panel presents device-specific traffic information, some of which is also
presented in graphical form. For example, average number of connections and number of
translations for firewall devices (over the most-recent polling period), and average inspection
load and percentage of missed packets for IPS sensors (over the most-recent polling period).
–
Interfaces – A listing of all interfaces defined on the device, with current status information.
• For the VPN Summary view, the tabbed panels are:
–
VPN Usage – Several graphs presenting information such as active site-to-site tunnels, active
remote-access sessions, and total throughput. This includes historical trending information for
active Site-to-Site tunnels, active IPSec remote-access users, active SSL VPN clientless users,
and active SSL VPN with client users.
–
License Information – A read-only listing of license information by VPN type, or IPSec and
SSL license and load information, depending on your selection in the table above. For the
System context of a multiple-mode device, VPN Licensing and allocation are shown; for
individual contexts, VPN allocation Limits and VPN licensing usage are shown.