


66-16
User Guide for Cisco Security Manager 4.4
OL-28826-01
Chapter 66 Viewing Events
Overview of Event Viewer
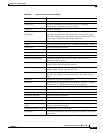
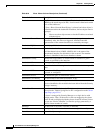
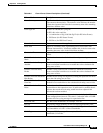
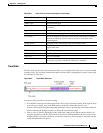
Columns in Event Table
The following table lists alphabetically, and describes, all the columns that you can display in a view in
Event Viewer. The columns applicable to a particular device vary, as does the presence or absence of
event data for a particular event type.
When you save a view, the columns you selected, and their order, are preserved and displayed the next
time you open the view. To select which columns to display in the open (and active) view, do one of the
following:
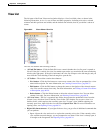
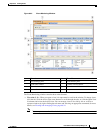
• (Preferred method.) Click the Column Chooser icon in the far right of the event table header row
(see Event Monitoring Window, page 66-12). The Choose Columns to Display dialog box that opens
lists the columns in alphabetical order. You can select or deselect the columns either individually or
by using the Select/Unselect All check box. Also, you can click Revert to return to the default
column selection for the view.
• Select View > Customize Columns.
• Right-click any column heading and select or deselect a column individually, or select More to open
the same dialog box that is used by the View > Customize Columns command.
Note Most columns other than Description, Event Name, and Receive Time include a filtering function. For
more information, see Creating Column-Based Filters, page 66-41.
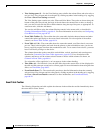
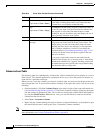
5Start
(Equivalent to View > Start.)
Click Start to reload or restart the listing of events in the
Event Table. Clicking Start retrieves any events that have
occurred since you originally loaded the table.
6Stop
(Equivalent to View > Stop.)
Click Stop to halt the listing of events in the Event Table. If
you are in a real-time view, the Time Selector indicates the
time stopped as well as the time interval that is loaded.
Clicking on stop can also halt a query and display the set of
events currently loaded in event viewer.
7Clear Click Clear to empty the event table.
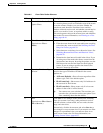
8 Event Enumerator and
messages
The number shown on the right of the toolbar indicates how
many events are loaded onto the Event Viewer client. The
number grows as events are loaded until either all events
matching the filter criteria are displayed, or the pagination
limit is reached, whichever is lowest. If you change the
pagination limit (see Event Management Page, page 11-22),
you must exit Event Viewer and open it again for the new
limit to be in effect.
If your query requires that events be retrieved from the
extended event storage area, a message such as “Data being
fetched from extended store” appears. Fetching events from
the extended storage area typically takes longer than fetching
them from the primary storage area.
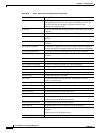
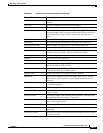
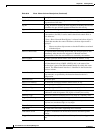
Table 66- 5 Even t Tabl e Too lbar Elements (Continued)
Callout Name Description