66-55
User Guide for Cisco Security Manager 4.4
OL-28826-01
Chapter 66 Viewing Events
Examples of Event Analysis
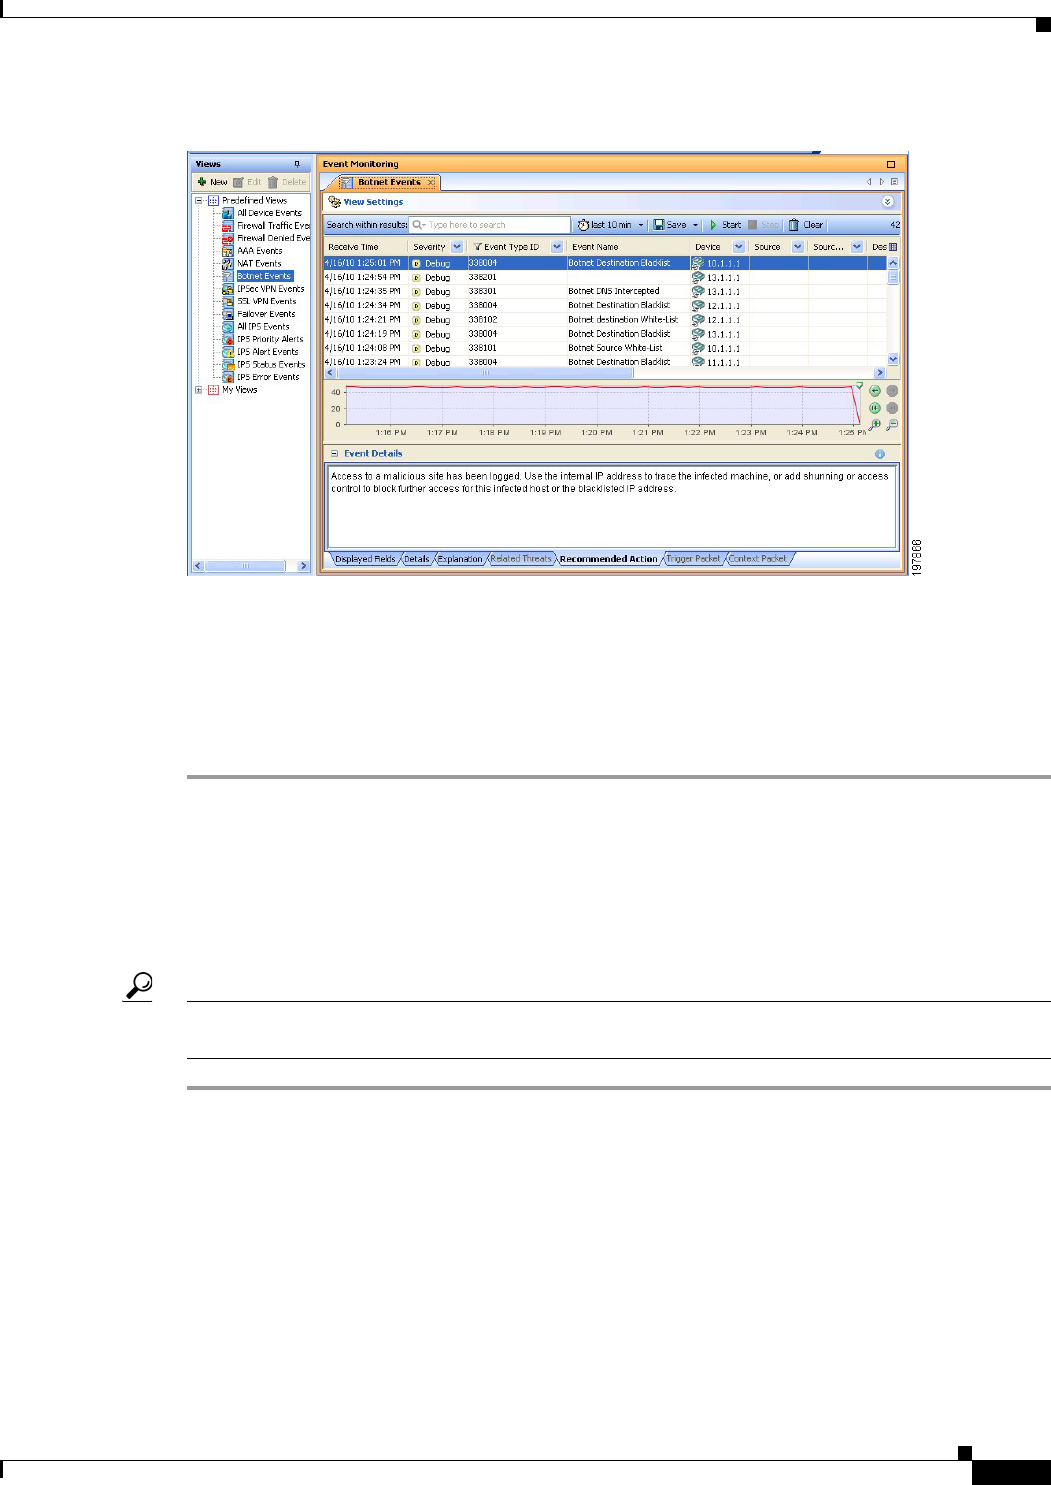
Figure 66-7 Botnet Event Details for Message 338004, Botnet Destination Blacklist
Step 4
To narrow the list of events to those generated by a single ASA, click the drop-down arrow in the Device
column and select the desired device from the list. If you want to narrow the list to multiple ASAs, select
Custom from the drop-down list and select the desired devices in the dialog box that appears.
You can also narrow the list using filters for any of the other columns. Filtering works the same way for
all columns: either select the desired value from the drop-down list, or select Custom to create a more
complex column filter.
Monitoring Botnet Using the Security Manager Report Manager
You can use the Report Manager application to generate reports on botnet activity. There are predefined
reports that show the top infected hosts, the top malware ports, and the top malware sites. For a
description of these reports, see Understanding Firewall Summary Botnet Reports, page 67-14.
Tip This procedure assumes the Event Manager service is enabled. If it is not, enable it using the Tools >
Security Manager Administration > Event Management page.
Step 1 Open Report Manager, for example, by selecting Launch > Report Manager in Configuration Manager.
Step 2 Open the desired report from the System > FW > Summary Botnet folder. You can open the report by
double-clicking it or by right-clicking and selecting Open Report.
Step 3 (Optional) Customize the report to select the desired time range and devices to include in the report. For
more information, see Editing Report Settings, page 67-21.
If you want to save your custom settings to generate the report again in the future, click Save As to create
a custom report. For more information, see Creating Custom Reports, page 67-20.
Step 4 Click Generate Report to retrieve the collected information and display the graphs and tabular data. For
more information, see Opening and Generating Reports, page 67-18.